
The National Center for Education Statistics recently published its annual report, The Condition of Education 2017, which showcases national trends in education using data from the 2014-15 academic year. Below are higher education highlights from the report:
1.) The more education earned, the higher the medial annual earnings.
For young adults ages 25–34 who worked full time, year round, higher ed attainment was associated with higher median earnings; this pattern was consistent from 2000 through 2015. For example, in 2015 the median earnings of young adults with a bachelor’s degree ($50,000) were 64% higher than those with only a high school diploma ($30,500). In addition, median earnings of young adults with a master’s or higher degree were $60,000 in 2015, some 20% higher than those with a bachelor’s degree.
Median annual earnings of full-time, year-round workers ages 25–34, by educational attainment: 2015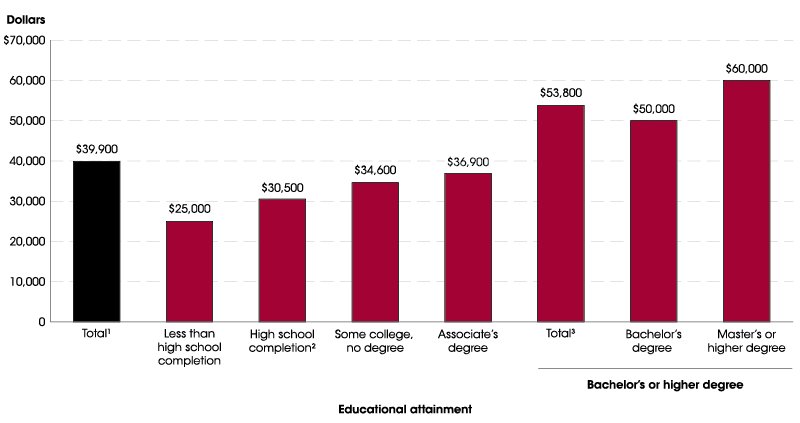
2.) Yet, median annual earnings have fallen in nearly every education attainment level.
Median earnings (in constant 2015 dollars) of 25-34 year-olds who worked full time, year round declined from 2000 to 2015 at most educational attainment levels. During this period, the median earnings of those with only a high school diploma declined from $34,400 to $30,500 (-11%), and the median earnings of those with some college education declined from $39,700 to $34,600 (-13%). In addition, the median earnings of those with an associate degree declined from $41,300 to $36,900 (-10%), and the median earnings of those with a bachelor’s degree declined from $54,900 to $50,000 (-9%).
Median annual earnings of full-time, year-round workers ages 25–34, by educational attainment: 2000–2015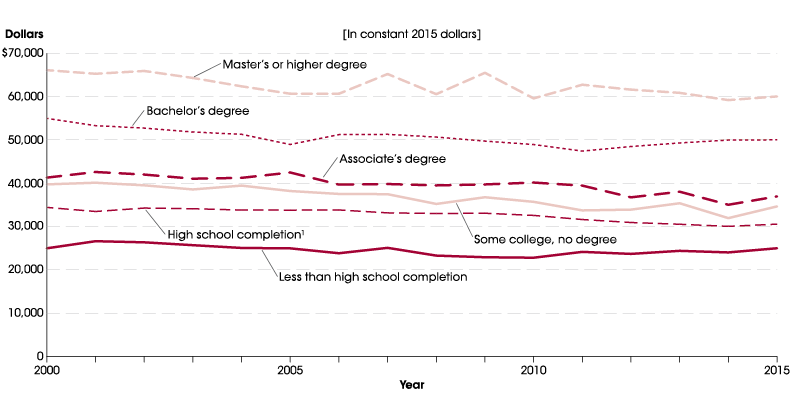
3.) The ratio of full-time equivalent (FTE) students to faculty is lower than ten years ago.
The ratio was 15:1 in 1995, 15:1 in 2005, and 14:1 in 2015. In 2015, the FTE student-to-faculty ratio was higher at private for-profit 2-year and 4-year (21:1) and public 2-year institutions (19:1) than at private nonprofit 4-year (10:1) and public 4-year institutions (14:1).
4.) Despite some recent dips nationally, enrollment has increased by 30% from 2000-2015, and is projected to increase by 14% over the next ten years. In Utah, enrollment is projected to grow by 34% in the same time frame.
In fall 2015, total undergraduate enrollment in degree-granting postsecondary institutions was 17.0 million students, an increase of 30% from 2000, when enrollment was 13.2 million students. While total undergrad enrollment increased by 37% between 2000 and 2010, enrollment decreased by 6% between 2010 and 2015. Nationally, undergrad enrollment is projected to increase by 14% (from 17.0 million to 19.3 million students) between 2015 and 2026.
Meanwhile, the projected headcount of students attending USHE institutions is expected to grow by 34% in the next ten years.
Total USHE Projected Headcount, 2016 (actual) – 2026
5.) Part-time enrollment is expected to increase slightly more than full-time enrollment in the next ten years.
Enrollment for both full- and part-time students has generally increased since 2000, particularly between 2000 and 2010, when full-time enrollment increased by 45% and part-time enrollment increased by 27%. More recently, the pattern of enrollment has changed: between 2010 and 2015, full-time enrollment decreased by 7% and part-time enrollment decreased by 3%. Between 2015 and 2026, full-time enrollment is projected to increase by 13% (from 10.6 million to 11.9 million students) and part-time enrollment is projected to increase by 15% (from 6.4 million to 7.4 million students).
6.) Enrollments at private for-profit institutions are significantly down.
After peaking in 2010, enrollment at private for-profit institutions decreased by 38% (from 1.7 million to 1.1 million students) between 2010 and 2015.
7.) Degrees awarded to Hispanic students have doubled in the past ten years.
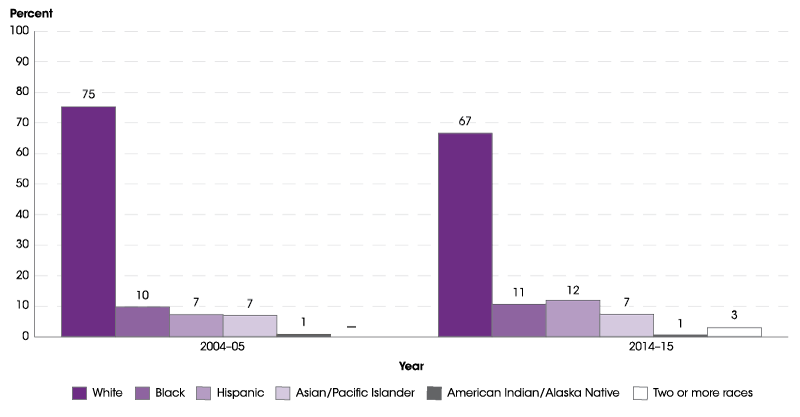
Between 2004–05 and 2014–15, the number of associate and bachelor’s degrees conferred to Hispanic students more than doubled and the number of master’s and doctor’s degrees conferred to Hispanic students nearly doubled. During this time, the number of degrees conferred increased across all degree levels for all racial/ethnic groups, except for American Indian/Alaska Native students.
Percentage distribution of bachelor’s degrees conferred to U.S. citizens by degree-granting postsecondary institutions, by race/ethnicity: Academic years 2004–05 and 2014–15
8.) Nationally, fewer students work today than in 2005. Utah has one of the highest percentages of working students in the nation at 65.7%.
The percentage of full-time undergraduate students who were employed was lower in 2015 (43%) than in 2005 (50%). This trend continued for part-time students: those employed in 2015 (78%) was lower than in 2005 (86%). In 2010 and 2015, the percentages of full- or part-time undergrads who were employed were not measurably different.
9.) Business is the most common field of study for bachelor’s degrees. Nearly half of the master’s degrees awarded in 2014-15 were in two fields of study: Business and Education.
For every racial/ethnic group, business was the most common field of study for bachelor’s degrees, followed by Health Professions/Related Programs and Social Sciences/History. For associate degrees, Liberal Arts and Sciences, General Studies, and Humanities; Health Professions/Related Programs; and Business Services were the top three fields of study.
In 2014–15, nearly half of the 759,000 master’s degrees were concentrated in two fields of study: business (185,000 degrees) and education (147,000 degrees). Of the 179,000 doctor’s degrees, almost two-thirds were concentrated in health professions and related programs (71,000 degrees) and legal professions and studies (40,300 degrees).
10.) Nationally, six-year graduation rates hover around 59% for bachelor’s degrees; in Utah, that number is 47%.
About 59% of students who began seeking a bachelor’s degree at a four-year institution in fall 2009 completed that degree within six years; the graduation rate was higher for females than for males (62% vs. 56%).
11.) All degrees and certificates saw a marked increase in number awarded in the last ten years.
The number of certificates and degrees awarded increased significantly at each level between 2004–05 and 2014–15: Certificates increased by 35%, associate degrees by 46%, bachelor’s degrees by 32%, master’s degrees by 31%, and doctorate degrees by 33%.
12.) Average net price of attendance was $13,200 at public 4-year institutions across the country; in Utah, that number is $11,335.
The average net price of attendance—total cost (includes room, board, books, etc.) minus grant and scholarship aid—for first-time, full-time students in 2014-15 was $13,200 at 4-year public institutions, $25,400 at 4-year private nonprofit institutions, and $21,500 at 4-year private for-profit institutions. For Utah’s 4-year public institutions, the average net price is $11,335, 16% less than the national average.
Additional information
The NCES report also includes an At a Glance section, which comparisons within and across indicators, and a Highlights section, which captures a key finding or set of findings from each indicator.
The report contains a Reader’s Guide, Glossary, and a Guide to Data Sources that provide additional information to help place the indicators in context. In addition, each indicator references the data tables that were used to produce the indicator, most of which are in the Digest of Education Statistics.